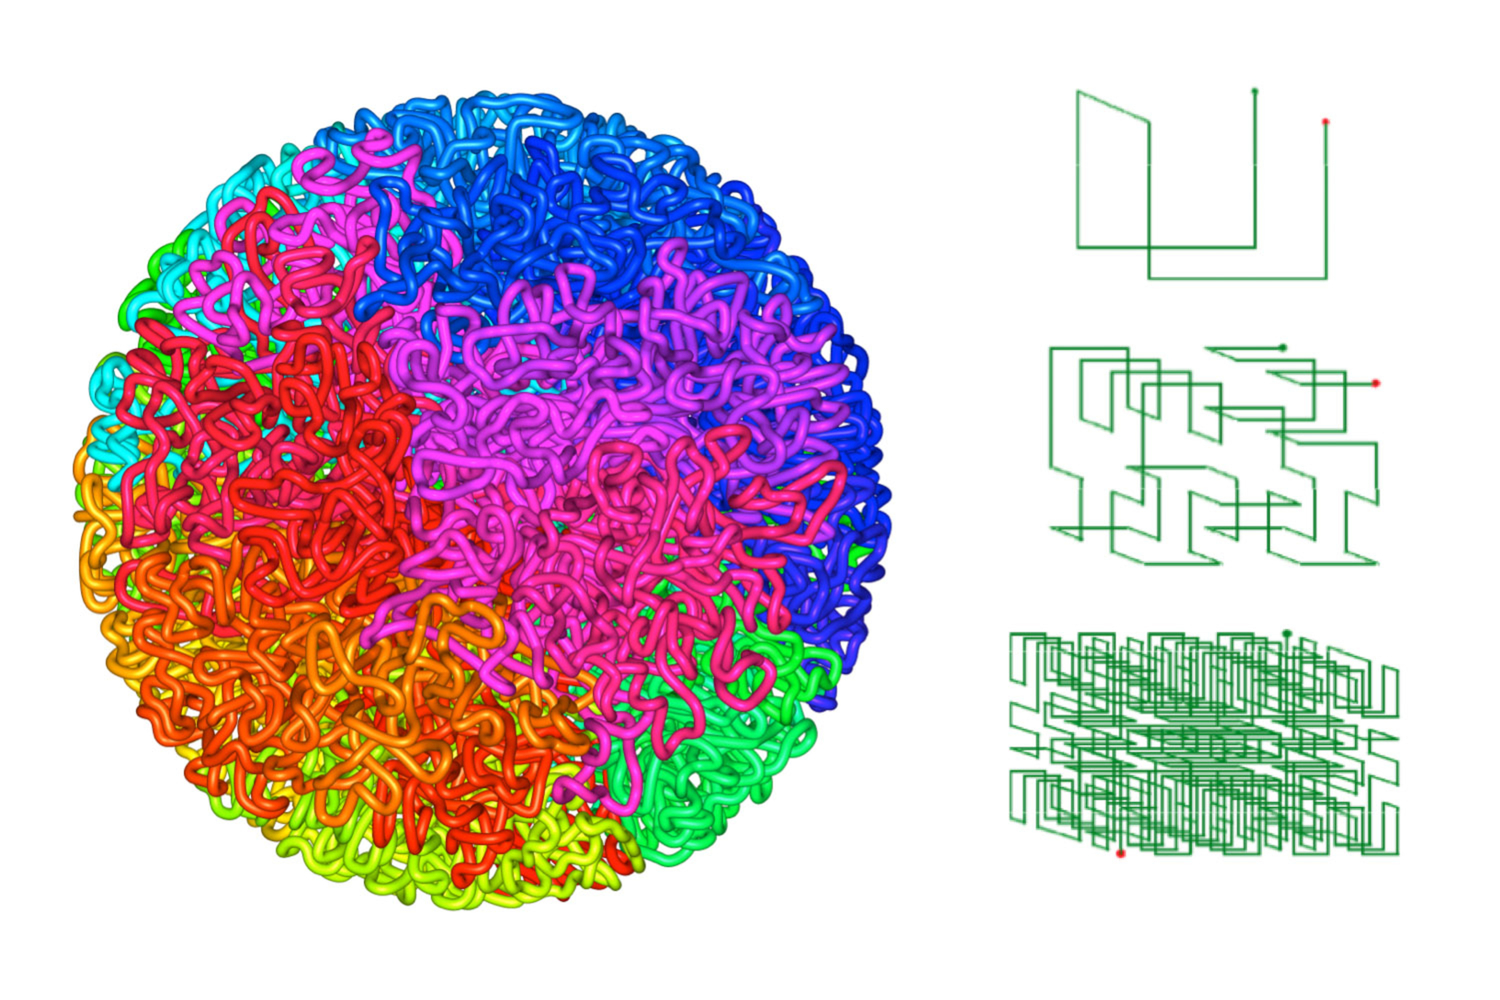
Figure 1. Using the fractal globule model and the Hilbert Curve to explain 3-dimensional genome architecture. The fractal globule at the left is formed from a single, long, linear contour that has folded back upon itself. Positions that are nearby along the 1D linear contour have a similar color; the clustering of positions with a similar color in space illustrates the fact that positions that are nearby in 1D tend to be nearby in 3D in a fractal globule. The simpler illustration at the right, showing the construction of the 3D Hilbert Curve, shows how a mathematical model of such a fractal globule can be constructed. In this iterative process, each line segment is folded into a seven-segment pattern with the same start- and end-point as the original segment. The resulting contour is precisely defined, fitting into the same initial volume vis-a-vis an increasingly tortuous trajectory, which is why such curves are known as “space-filling.” The Hilbert Curve was first constructed by the mathematician David Hilbert in 1891 (Hilbert, 1891). Inspired by the Hilbert curve, the fractal globule model for polymers such as the genome was first proposed in 1988 (Grosberg, Nechaev, & Shakhnovich, 1988). Empirical evidence in support of the model is provided in Lieberman-Aiden & Van Berkum et al., 2009.
Left: Huntley, M. and Aiden, E.L. 2015. Image is based on work published in Sanborn & Rao et al., 2015b. Right: Aiden, E.L. 2009. Image first published in Lieberman-Aiden & Van Berkum et al., 2009.
/
-
(2009)