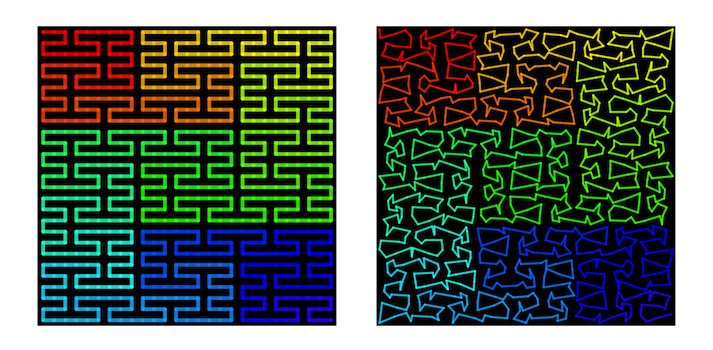
Figure 11. 11A (left side) is a traditional representation of the Peano curve, in which the curve is plotted at fixed intervals. 11B (right side) is an alternative representation, in which the curve is plotted at random intervals. This small change makes it more closely resemble a physical trajectory, although it is a visual manifestation of the very same mathematical object as in 11A.
Aiden, E. L. Construction details for the panel at right are given in Lieberman, 2010.
/
-
(2011)