skip to main content
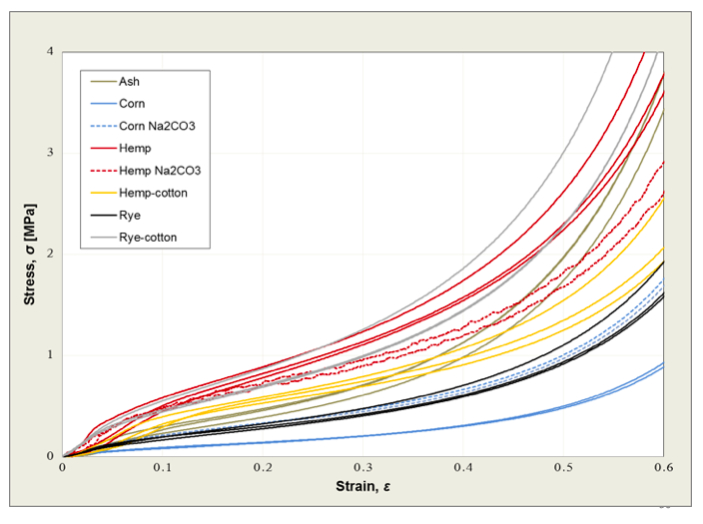
Figure 3. Data from a stress test on eight different papers completed at the lab of Associate Professor Sameh Tawfick (
https://mechse.illinois.edu/people/profile/tawfick
) at the University of Illinois.
View Original Image